Spectroscopy Overview
SXM Viewer loads spectroscopy files automatically when a folder is opened, associating them with images using robust timestamp-based matching. Spectroscopy data and scan images live in the same workspace rather than requiring separate tools.
Spectroscopy thumbnails
Associated spectroscopy files appear as miniature thumbnails within the main thumbnail grid, positioned near their spatially associated scan image. Markers on the scan thumbnails indicate where each spectroscopy was acquired.
Thumbnail marker customisation
Right-click a spectroscopy thumbnail -> Miniature channel to choose which channel drives the miniature plot. Marker size, colour, and symbol are also customisable for better visibility on different backgrounds.
Selection
| Gesture | Effect |
|---|---|
| Single click | Select spectroscopy |
| Shift+Click | Range-select |
| Ctrl+Click | Add or remove from selection |
| Drag | Rubber-band selection |
| Double-click | Open spectroscopy popup |
Spectroscopy browser
Open the Spectroscopy Browser from the toolbar. It presents all associated spectroscopy files as a multi-column table with sortable columns. From the browser you can:
- select single or multiple spectroscopies
- open them in the spectroscopy popup
- reuse the same popup while appending more traces
- apply a channel preset to selected entries
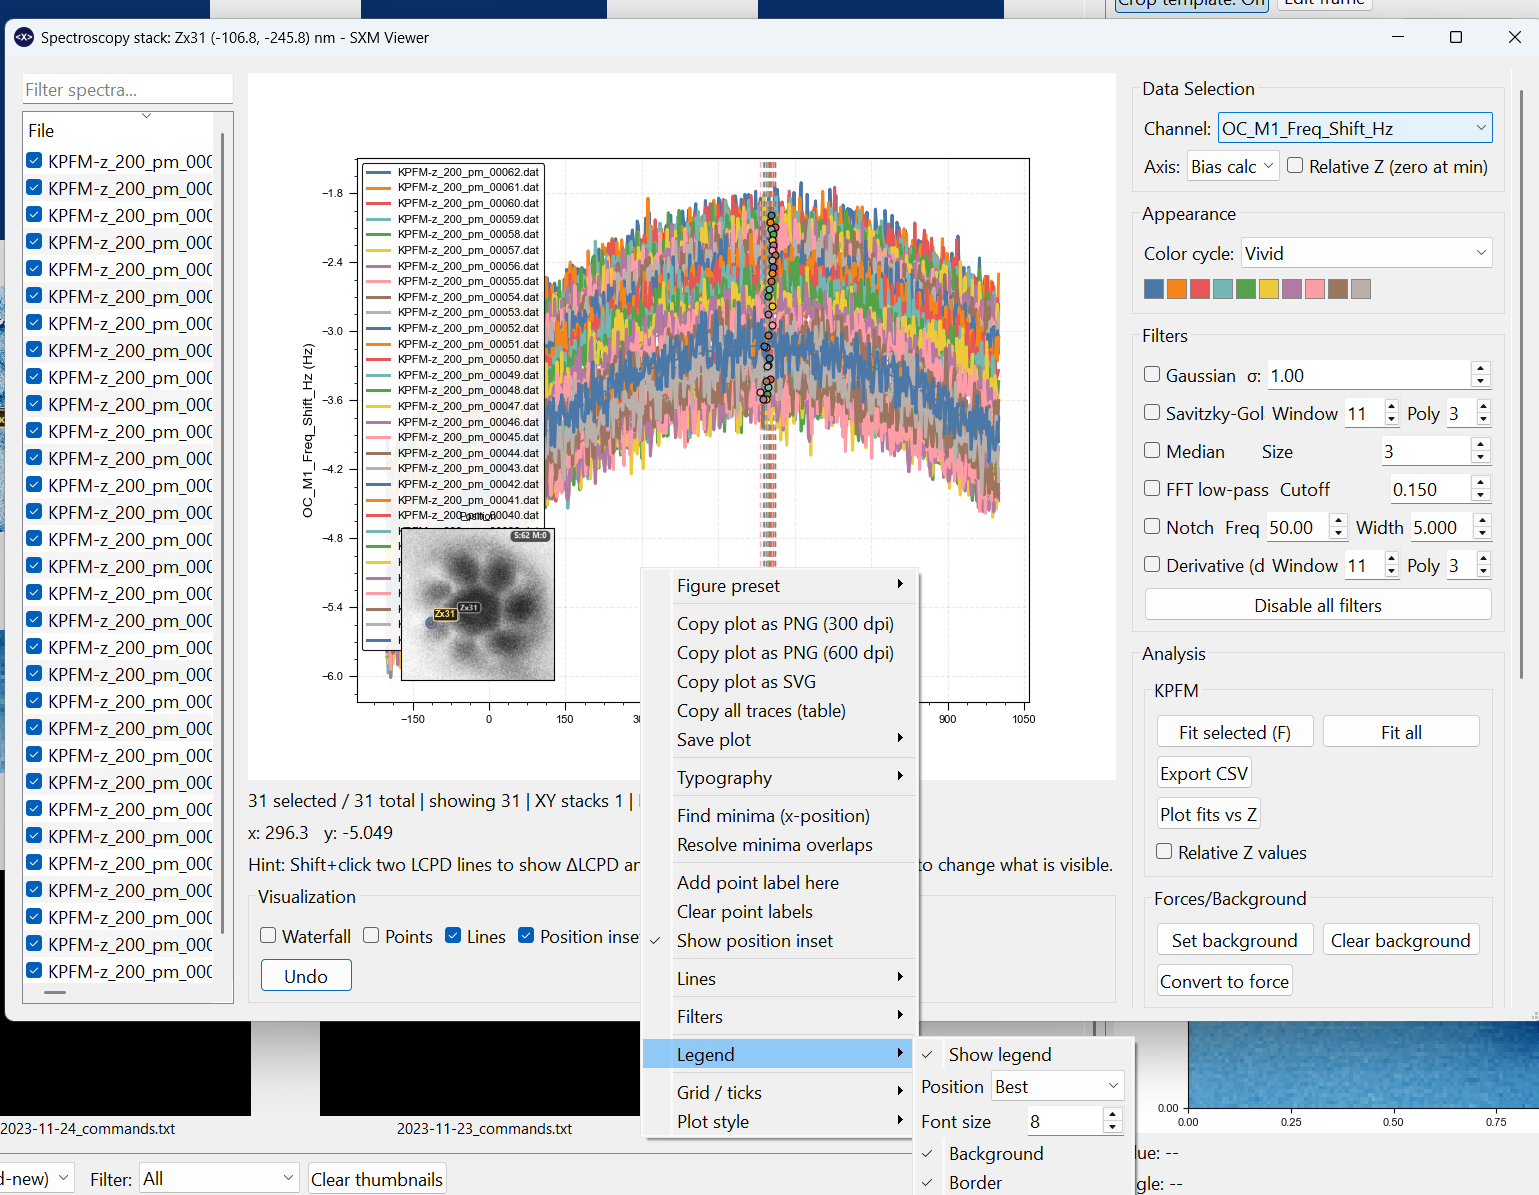
Spectroscopy popup
The spectroscopy popup uses the same general layout style as the profile-measurement window: plot on top, control strip underneath, advanced controls on demand, and a trace list below.
It can display one spectrum or several overlaid traces in the same window.
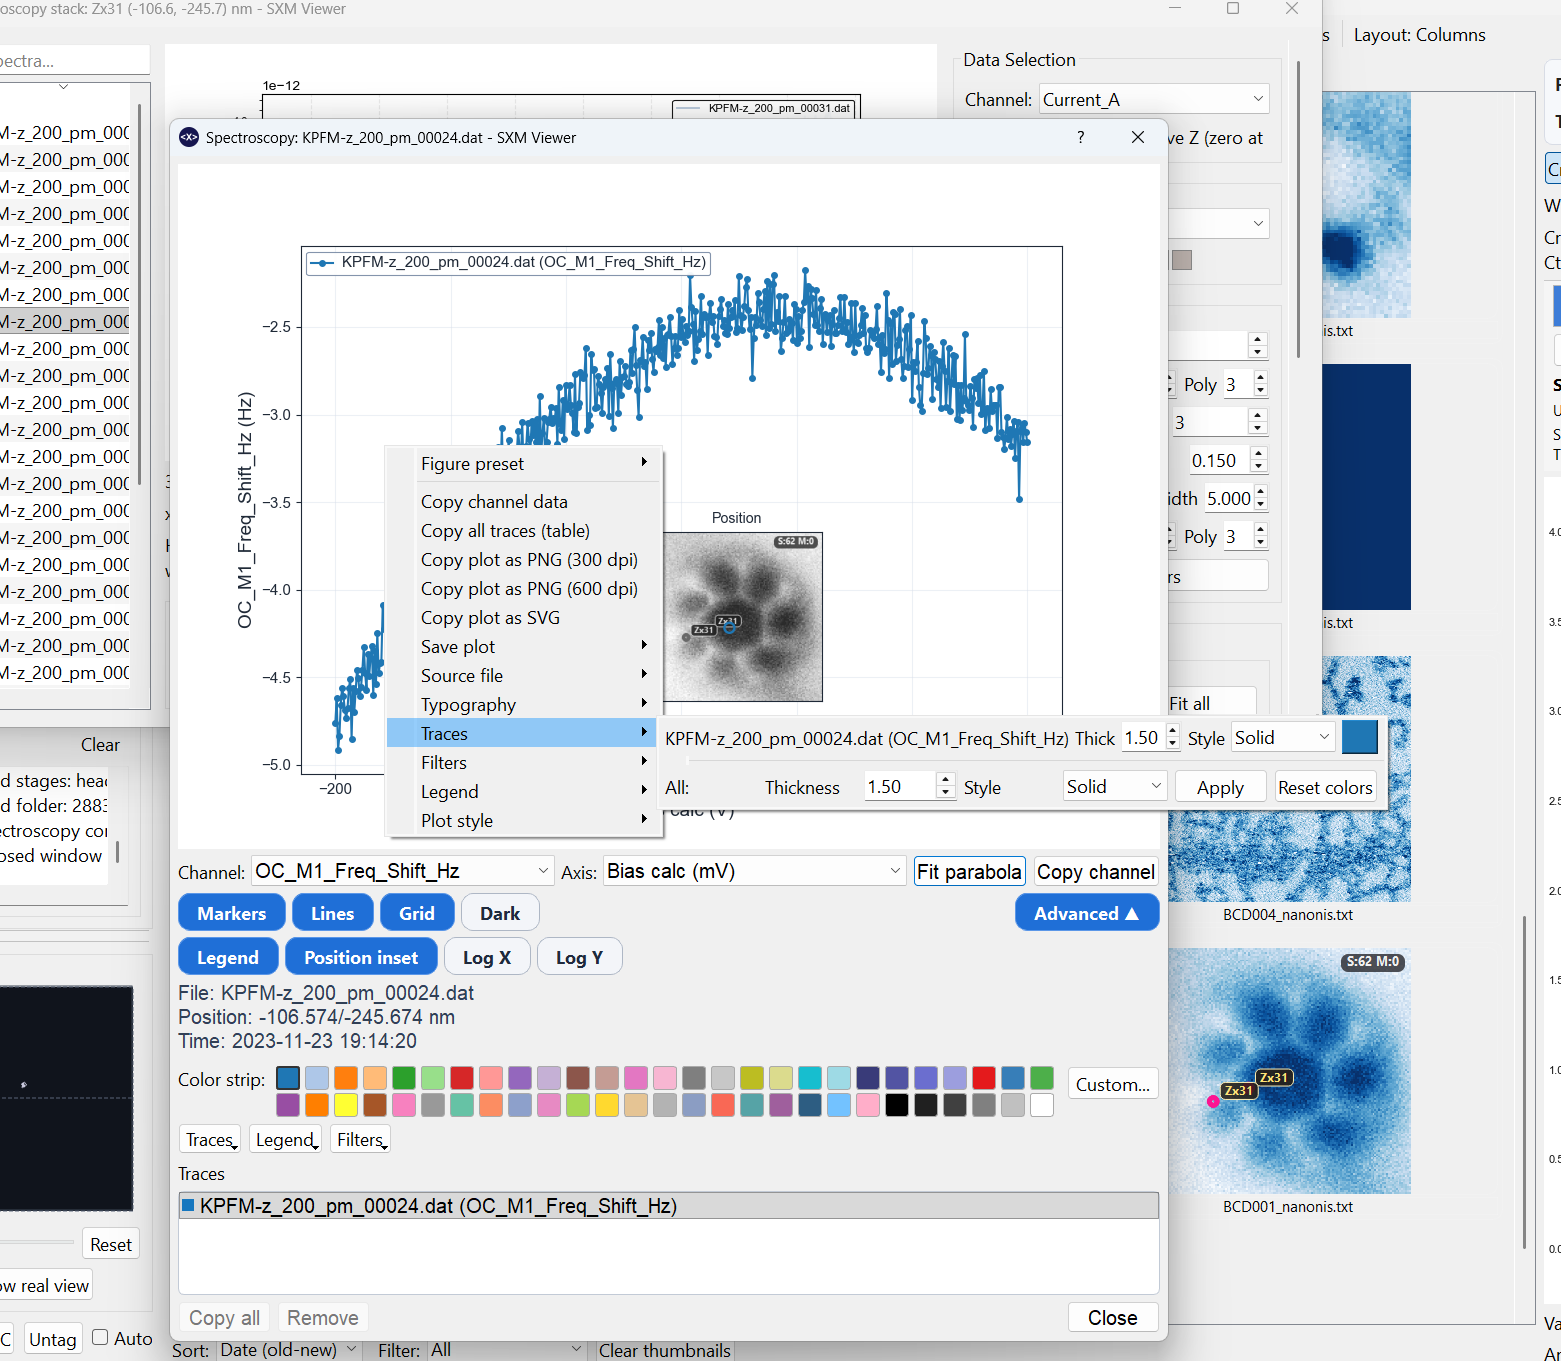
Core controls
The main popup keeps the high-frequency controls visible:
- Channel
- Axis
- Fit parabola
- Copy channel
- toggles for Markers, Lines, Grid, and Dark
Advanced controls
The Advanced section exposes:
- Legend toggle
- Position inset
- Log X / Log Y
- colour swatches for the active trace
- menus for Traces, Legend, and Filters
Trace styling
The popup supports per-trace visual editing without needing the full comparison dialog:
- change trace colour
- change line thickness
- change line style
- apply a style to all traces
- reset trace colours to the active palette
The trace list also supports right-click styling for the currently selected trace.
Legend editing
The popup legend supports:
- show or hide
- position
- font size
- background on or off
- border on or off
Filters
Single-spectrum popups can now apply the same core signal-processing stack used in the comparison workflow:
- Gaussian smoothing
- Savitzky-Golay smoothing
- Median filtering
- FFT low-pass
- Notch filtering
- first derivative
dY/dX
These are display and analysis filters for the plotted traces; they do not rewrite the source file.
Typography and export
Font family, bold, italic, and underline are accessible from the right-click Typography menu and stay consistent with the rest of the GUI.
Right-click the spectroscopy plot for:
- PNG, SVG, and PDF export
- direct data-copy actions
- trace styling
- legend editing
- source-file actions
Source-file actions
Both spectroscopy thumbnails and spectroscopy popups expose a Source file submenu so you can:
- show the underlying file in the operating-system file manager
- open the file in the default text editor for the current OS
- copy the full file path
Spatial markers on images
When spectroscopy display is enabled, markers appear on the preview and pop-outs at the acquisition positions. Toggling spectroscopy on or off does not reload the data; the association is cached.
Marker positions are correctly placed in both absolute and relative axes display modes.
Supported spectroscopy types
- Single-point I(V), I(z), df(V), df(z) traces
- Grid or matrix spectroscopy (see Matrix Scans)
- KPFM data (see KPFM)
- Parabola fits (see Parabola Fits)
- WSxM XYZ export