Profiles & Measurements
Drawing a profile
Hold Ctrl and click on the preview or any pop-out to start a new profile line. Drag to set the endpoint and release. The Profile measurement dialog opens automatically with the extracted line profile.
Plain click does not start a profile — it only selects. This prevents accidental profile creation during normal navigation.
After creating a profile you enter a move-only state: you can drag the existing profile line and endpoints freely, but a new profile still requires holding Ctrl and clicking.
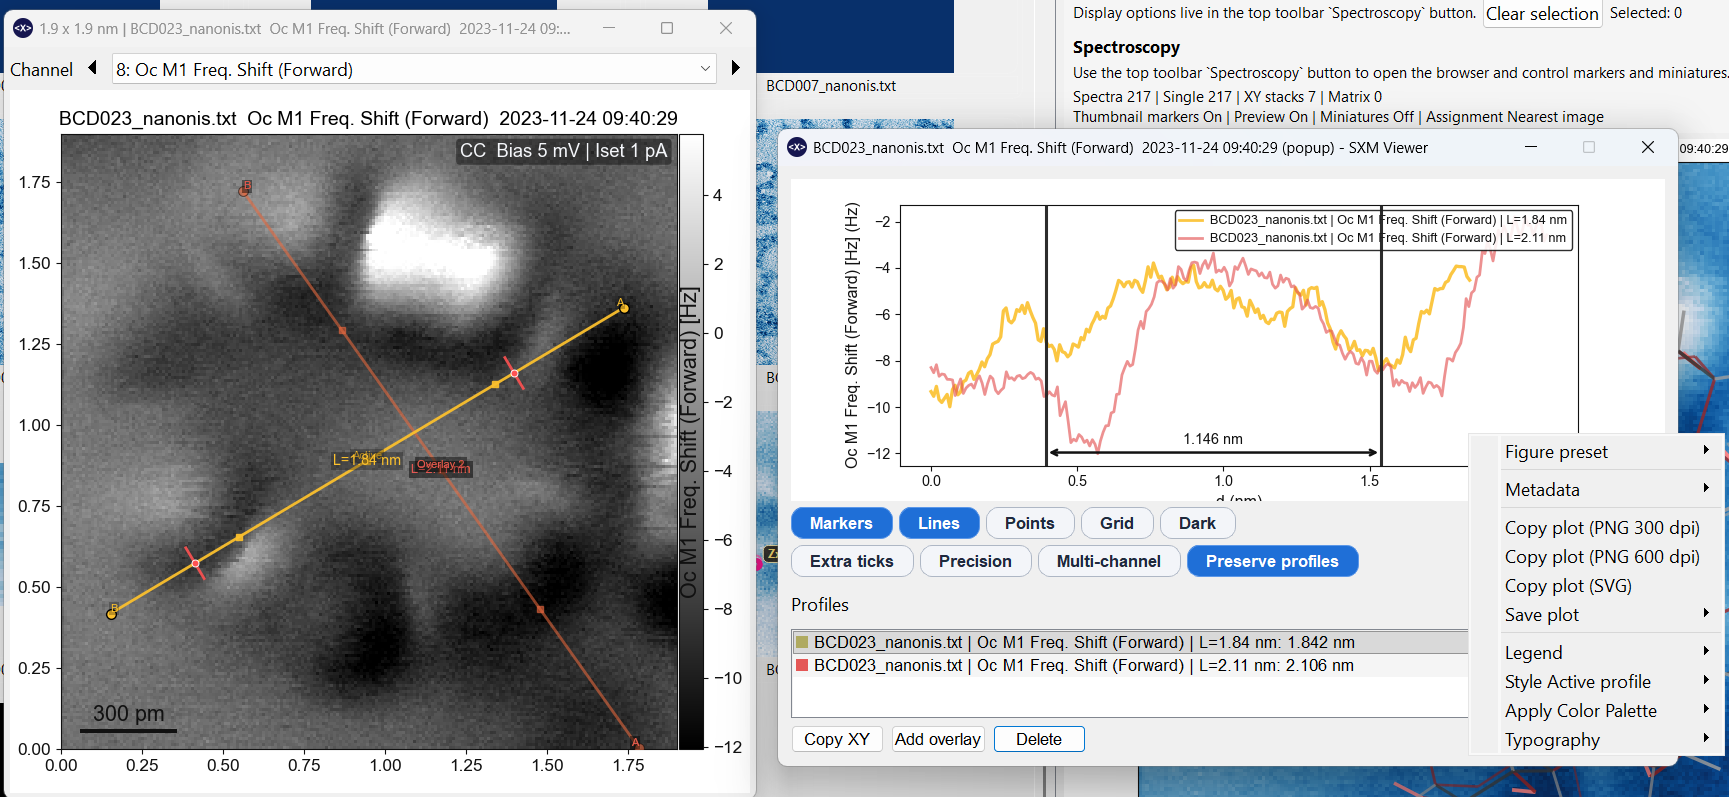
Profile measurement dialog
The dialog shows the profile plot with controls arranged as compact pill toggles:
Primary toggles (always visible):
| Toggle | Shortcut | Effect |
|---|---|---|
| Markers | V | Show/hide data point markers |
| Lines | L | Show/hide connecting lines |
| Points | P | Show/hide individual data points |
| Grid | G | Toggle grid lines |
| Dark | — | Toggle dark theme for the plot |
Advanced toggles (press A to show):
| Toggle | Shortcut | Effect |
|---|---|---|
| Extra ticks | T | Additional tick marks |
| Precision | R | Higher-precision axis labels |
| Multi-channel | M | Show profiles from all channels simultaneously |
| Preserve profiles | — | Keep profiles when switching images |
Saved profiles (overlays)
A profile remains active while the tool is armed. You can save it as a permanent overlay that persists across channel switches and image navigation:
Right-click the profile line or the profile list → Save as overlay.
Saved profiles appear as overlays on the canvas and as entries in the profile list. Use Ctrl+1 to toggle their visibility.
Styling overlays
Right-click a saved profile in the list or on the plot to access styling options:
- Color picker
- Line thickness
- Line style (solid, dashed, dotted)
- Marker shape and size
- Apply a palette to multiple profiles
Style changes propagate immediately to the canvas overlay.
Deleting overlays
Select an entry in the profile list and press Del or Backspace.
Angle and distance measurements
Within the profile measurement dialog, you can also measure angles and distances between points annotated on the profile plot. See Angle Measurements for the dedicated angle tool on the image canvas.
Multi-channel profiles
Enable Multi-channel (M) to extract and overlay profiles from all simultaneously acquired channels in a single plot. Each channel is plotted with a distinct colour.
Composite profiles
You can merge profiles from multiple images or pop-outs into a single composite profile dialog:
- Open profile dialogs on two or more windows.
- Drag the profile-set handle from one profile window onto another.
- A new composite dialog opens, combining the curve sets.
Source-aware curve labels distinguish which image each profile came from. You can delete individual curves in the composite without affecting the originals.
Publication figure size presets
The profile plot metadata menu includes figure size presets that resize the dialog and canvas to match physical journal dimensions:
- Journal 1-col square (88 mm)
- Journal 1-col square (85 mm)
- Slides square (127 mm)
Copying profile plots
Right-click the profile plot surface → Copy as PNG or Copy as SVG.
Profiles in pop-outs and sessions
- Profiles created in the main preview are not inherited by pop-outs (and vice versa) unless explicitly saved.
- Profile measurement dialogs are detached from the main-window stacking order so interacting with them does not push image pop-outs behind the main GUI.
- Sessions save and restore all profile state including profile measurement window geometry.