Spectroscopy Browser
The Spectroscopy Browser provides a table-based view of the spectroscopy data associated with the current workspace.
What it shows
Open the browser from the toolbar. It presents spectroscopy entries in a multi-column table rather than only as markers or miniatures in the thumbnail grid.
This is useful when you want to:
- sort and inspect many associated spectra
- select several entries quickly
- open or augment spectroscopy popups from a structured list
Common actions
From the browser you can:
- select single or multiple spectroscopies
- open them in a spectroscopy popup
- reuse the same popup while appending more traces
- apply channel presets to selected entries
The project history also describes a waterfall plotting workflow and richer plot context menus for spectroscopy windows.
Selection behavior
Selection is designed to work like the rest of the UI:
- single click selects one spectrum
- Shift/Ctrl selection builds multi-selection
- multi-selection can feed a shared popup instead of creating a new one every time
This is especially helpful when comparing a group of related curves.
Relationship to thumbnail markers
The browser complements the thumbnail-grid workflow rather than replacing it.
Use:
- the thumbnail grid when you want image-first navigation with spatial context
- the browser when you want a sortable, table-like spectroscopy workflow
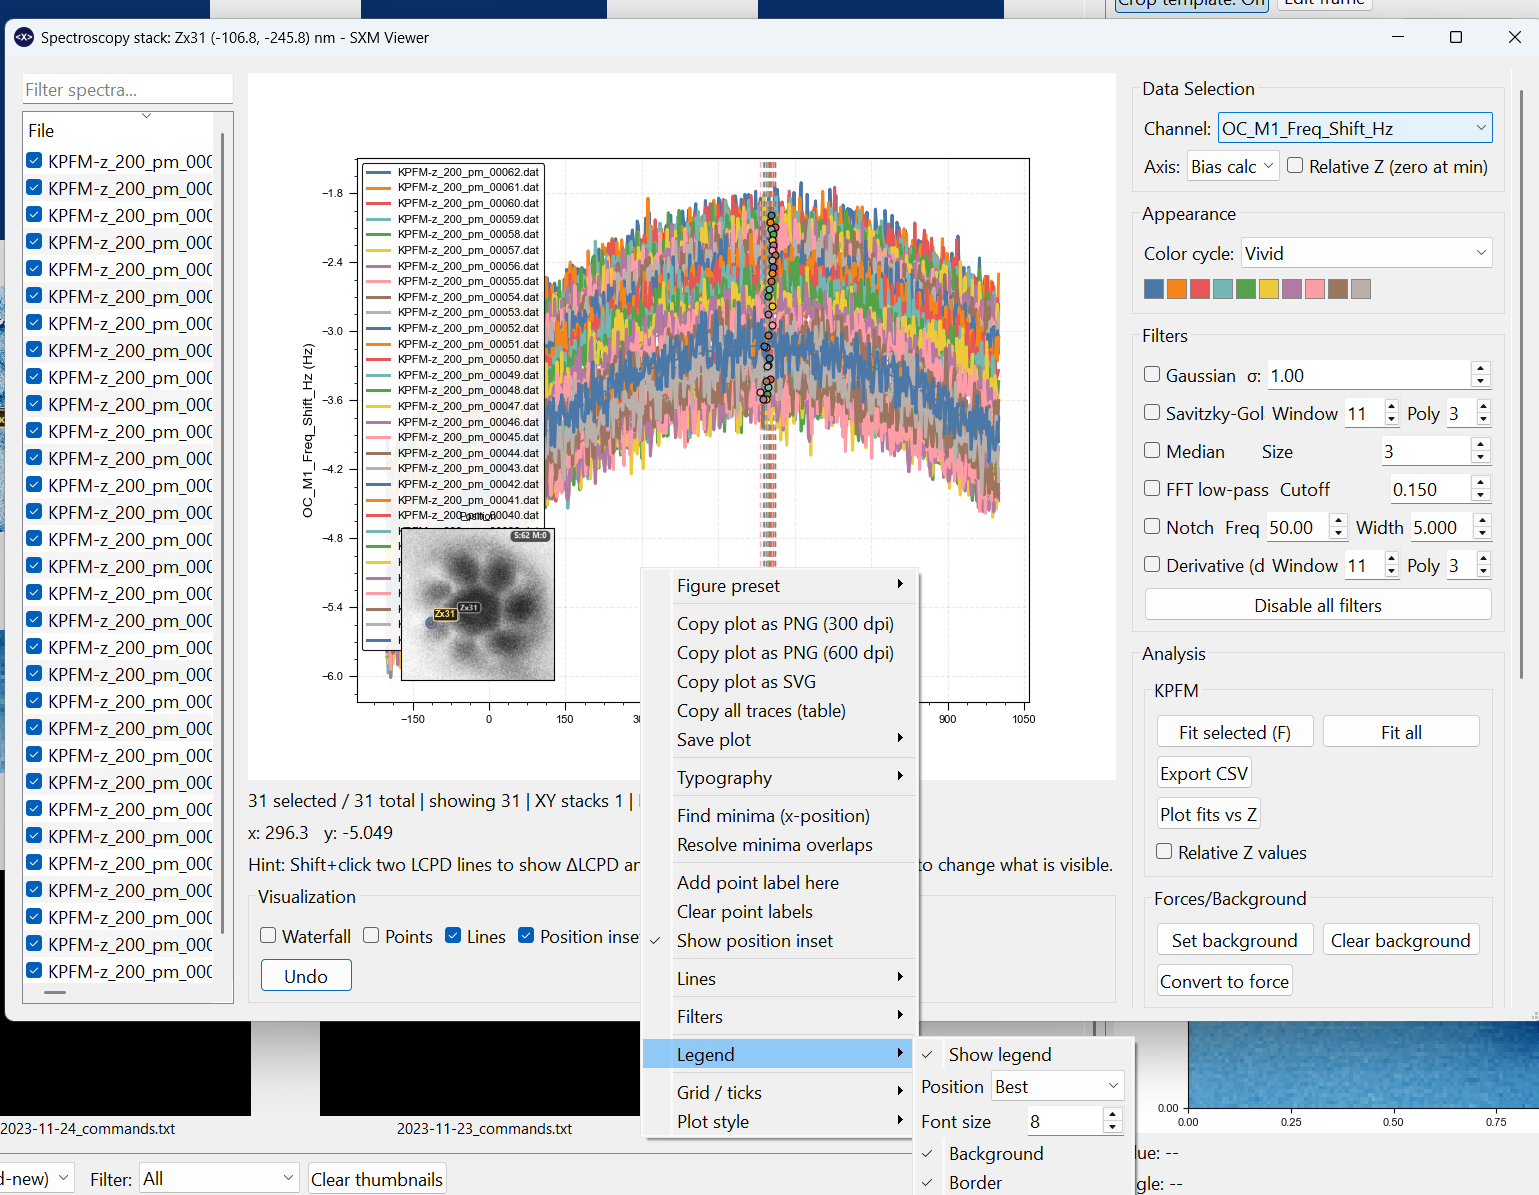
Plot controls
Spectroscopy windows support a richer set of display controls, including:
- grid, line, point, and dark-background toggles
- per-trace styling for colour, thickness, and line style
- legend editing for position, font size, background, and border
- smoothing and derivative filters
- typography and export or copy actions